

A set of tools to reproduce communication traffic of parallel applications in high-performance interconnection network Simulators
Authors: Miguel Sánchez de la Rosa (UCLM), Gabriel Gómez López (UCLM), Francisco J. Andújar (UVA), Jesús Escudero Sahuquillo (UCLM), Pedro J. García (UCLM), Francisco J. Alfaro (UCLM), Francisco J. Quiles (UCLM) and Jose L. Sánchez (UCLM).
Simulation is a popular method to evaluate the behavior and performance of IT systems, such as HPC clusters or data centers, and has been extensively used to model and evaluate new designs for high-performance interconnection networks, such as those used in data centers. Many simulation tools have been proposed to model interconnection networks, such as OMNet++-based simulators (e.g., INET, ib_model, or SAURON), NS-3, SST, or CODES. These simulators can generally model the network components and their architecture, with different levels of detail or abstraction. Apart from the interconnection network architecture, another important aspect that network simulators need to offer is the ability to reproduce realistic workloads in the interconnection network. In many cases, the simulation frameworks only model ad hoc or synthetic traffic patterns, which do not reproduce the behavior of the communication operations observed in the Data Centre Networks (DCNs) of real data centers.
The VEF traces framework comprises several tools that allow the simulators’ developers to model network workloads based on MPI applications. One of these tools is the VEF-Prospector [1], which captures the application MPI calls, and gathers them in trace files using a special format (i.e., VEF). These traces can be used to reproduce the application behavior in network simulators, provided that these simulators use another VEF framework tool: the TraceLib library [2]. This library can be integrated with any simulator, and it is in charge of reading the VEF trace and generating the corresponding messages that are inserted in the simulated NICs so that the simulator injects them into the network. This library is also responsible for collecting the packets received by the end-node NICs and finishing the communication operations. Moreover, TraceLib also permits running several applications (i.e., traces) simultaneously in the same simulation, configuring the task mapping of jobs to nodes, or choosing a different implementation of a given MPI collective communication algorithm. Most importantly, the VEF traces framework allows network simulators to reproduce the application behavior in a completely agnostic way, i.e., the end-node architecture and timestamps of the system gathering a VEF trace are not stored in the trace, but only the information of communication operations (e.g., source, destination, prior message dependency, etc.).
The VEF traces framework was selected as a target tool in WP1 of RED-SEA. There are several papers published describing the VEF traces framework and its use in simulation experiments [3], [4], [5].
1. VEF Traces framework overview
The VEF traces framework is a set of open-source tools developed to facilitate the modeling and characterization of the communication generated by MPI-based applications and to reproduce this modeling in network simulators. Essentially, the VEF traces framework offers a set of tools to capture the network traffic and generate self-related traces, called VEF traces. These traffic traces store the communication operations, both point-to-point and collective, and can be used to feed any third-party network simulator, provided that this simulator uses the TraceLib library included in the VEF traces framework. An overall picture of the framework is shown in Figure 1.
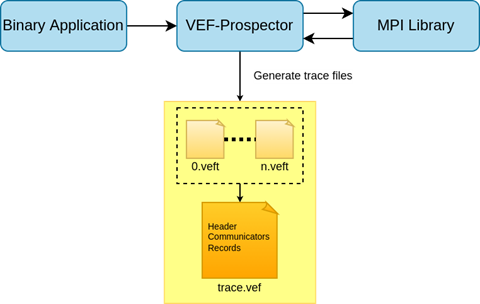
The VEF traces acquisition functionality is provided by the VEF-Prospector tool, which profiles an MPI application and generates the trace files. In more detail, VEF-Prospector captures the application MPI calls, interacting with the MPI driver through the MPI profiling interface (PMPI). Then, these calls are stored, together with other required information, in the VEF trace files. VEF-Prospector allows generating VEF traces without using third-party instrumentation tools. Moreover, the package can be used to profile the MPI application, detect MPI calls not yet supported in the trace format, and capture them, notwithstanding that those calls could not be modelled within VEF traces. Figure 1 also shows that the VEF traces can be used by third-party simulators, provided that these simulators link to the VEF-TraceLib library.
VEF-TraceLIB and VEF-Prospector can be downloaded via git. Further details to download, install, obtain traces, and use additional tools available in the VEF framework can be obtained in the Git repository readme file [1].
2. The VEF trace format
VEF traces contain all the communication that an MPI application performs during its execution. Specifically, the VEF trace file is a plain text file consisting of a set of records, each line of the trace being an independent record. There are three types of records in a VEF trace:
- Trace header. It contains basic information about the trace, such as the number of MPI tasks, the number of point-to-point messages, or the number of communicators. This header is the first line of the file.
- Communicators (or COMMs). A COMM specifies the MPI tasks involved in the exchange of messages generated by a collective communication. An MPI task can use several COMMs to communicate with different groups of MPI tasks.
- Communication records. These records contain the basic information about the communications, i.e., they model the MPI function calls (either point-to-point or collective) performed by a specific MPI task. The typical fields of a communication record are the source task, the destination task (or the COMM in collective communications), the message size, the processing time needed to perform certain tasks (e.g., CPU processing, read/write from/to secondary memory, etc.) before launching the following communication operation in the end-node, and a specific field indicating if that record has a dependency with other tasks of the trace (i.e., the self-related format).
It is worth mentioning that thanks to the VEF traces’ self-related format, each message (except the first one in the trace) depends on a message already generated or received, or on a collective communication already executed. To model this functionality, each trace communication record includes a field that indicates the type of dependency and the message (or collective communication) that satisfies the dependency.
3. How to generate VEF Traces?
Generating VEF traces consists of two steps:
Step 1
Intercepting the application calls to MPI libraries by using vmpirun. This step is trivial since vmpirun is a wrapper script that calls MPI functions and passes all the remaining arguments to the actual mpirun executable. The result of this execution is the creation of temporal files containing the calls for each MPI task (see Figure 2).
x.veftfiles contain each MPI call and its absolute timestamp for task x.
x.commfiles contain the communicators that task x is associated with.
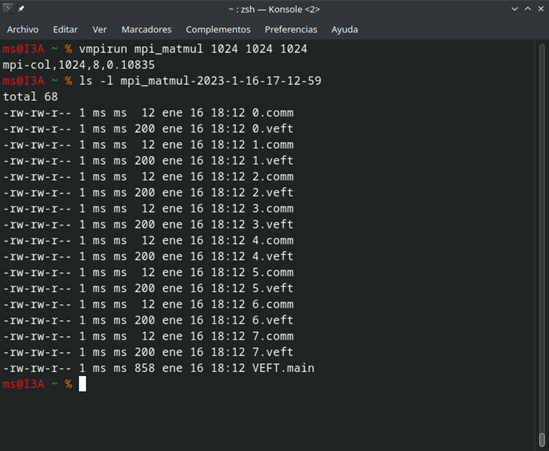
vmpirun command and its generated temporal files.Step 2
Once the temporal files are created, VEF-Prospector’s vef_mixer can merge all the .veft and .comm files into a .vef file that contains all the MPI calls from each task and the timestamps values converted to relative ones and in a human-readable format (see Figure 3).
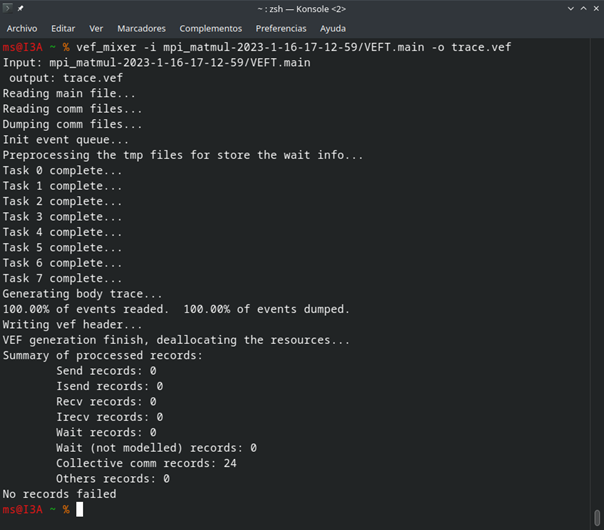
vef_mixer command.4. Offline analysis of VEF Traces
A VEF trace can be analyzed prior to its execution in a simulator. The VEF traces framework has two tools available for this purpose: tracetor and offline-vef-analysis.sh, which are described in this section.
Tracetor is a simple application to test VEF traces after they are generated through the VEF-Prospector tool. This application can be used to analyze the number of communication operations at a first glance, prior to reproducing them in a simulation environment. Running the tracetor command with the filename of a trace will run this simulation.
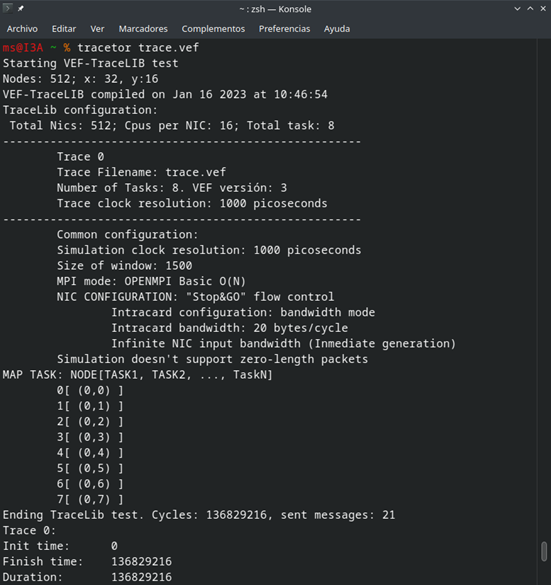
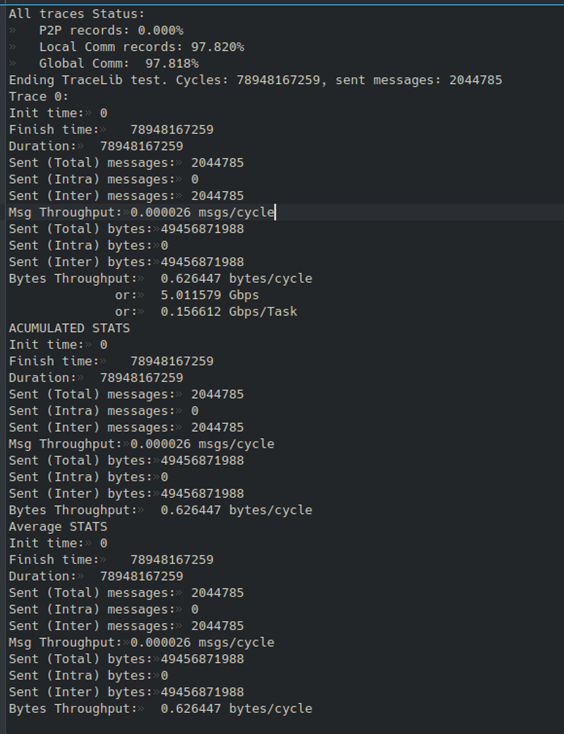
Figure 5 shows the most relevant fields shown by tracetor. Note that there are metrics that show the number of messages recorded in the VEF trace file, execution time assuming relative timestamps and in an ideal network (i.e., an infinite bandwidth bus), the number of bytes generated per time unit (i.e., throughput), etc. It is worth mentioning at this point that these metrics will vary depending on the network simulator used to reproduce the VEF trace behavior, and on the specific network configuration: topology, routing algorithm, buffering, link speed and latency, etc.
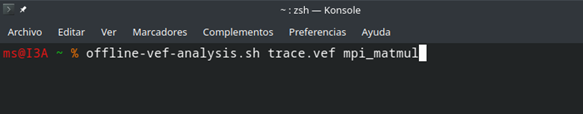
tracetor.offline-vef-analysis.sh: It is a script that analyzes the VEF trace and provides an extensive number of plots, text files, and PDF reports, with specific information about message generation, destination generation distribution, workloads size, number, and types of collective operations, etc., which are gathered in a VEF trace generated through VEF-Prospector.
This utility can be invoked by calling the script with a trace filename and a name for the application, or with a list of trace filenames to use as input.
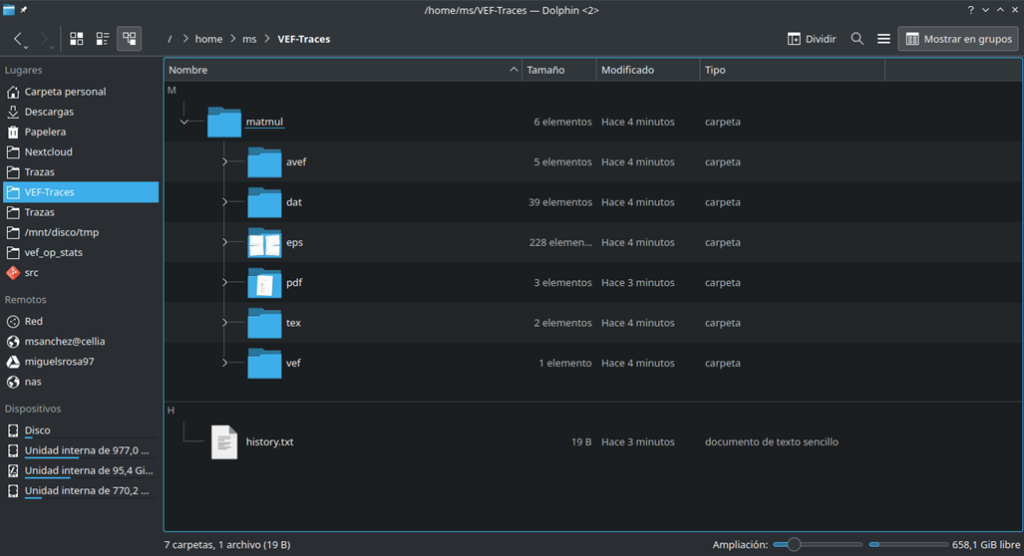
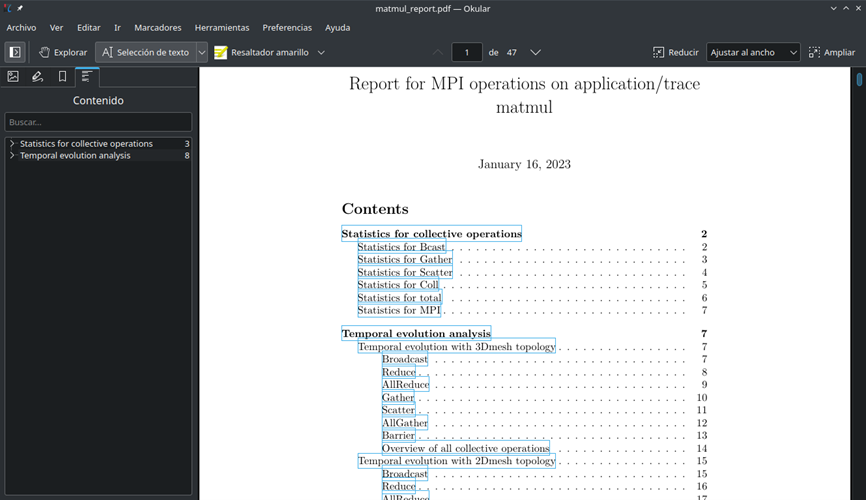
This script will generate a large set of plots including several metrics and stats from the VEF trace. Also, it will generate a PDF containing all of them (see Figures 7 and 8).
5. The TraceLib library
TraceLib is an open-source library that offers the functionality necessary to reproduce the VEF-traces behavior in an interconnection network simulator. TraceLib provides a set of functions for trace reading, task mapping to end nodes, trace execution management, and communication between the library and the simulator. Note that TraceLib performs all these functions in a transparent manner so that the network simulator only needs to ask the library to supply the application messages stored in a VEF trace. More precisely, the network simulator obtains the messages from TraceLib, injects them into the network, and returns the control to the library again when messages are received at the end nodes. However, the simulator must split these messages into packets, inject them into the network, and gather them at the destination end-nodes before reporting TraceLib that a message has been completely received.
For each generated message, TraceLib only provides the simulator with the source and destination end nodes, the message length, and the message-id (used to unequivocally identify that message within TraceLib). Note that the simulator does not need to know whether a specific message was generated by a point-to-point or by a collective communication, or if an application task is stopped waiting for messages that the simulator has not yet provided to TraceLib.
Moreover, TraceLib includes interesting features for simulator developers, such as the possibility of simulating multiple, even simultaneous traces, a flexible mapping scheme of MPI tasks to end-nodes, and the possibility of implementing specific collective communication functions (e.g., like those implemented by MPI-based drivers such as OpenMPI or MVAPICH). It is also possible to have idle end-nodes and end-nodes with multiple tasks allocated (even tasks from different traces). Finally, it is worth mentioning that the MPI collective communications have been implemented in TraceLib based on the algorithms available in the OpenMPI driver, although these algorithms can be extended and improved by the community since TraceLib is open source.
6. How to import the TraceLib library into my simulator?
To add support for TraceLIB in a simulator, the initialization of a configuration struct is required. This is an example configuration:
//Initialize the structure of the trace
    TraceLibConf = (conf_t *) malloc(sizeof(conf_t));
    TraceLibConf->simNodes = NumNodes;
    TraceLibConf->cpusPerNode = 0;
    TraceLibConf->noc_conf.noc_intranode_enabled = false;
    TraceLibConf->number_of_traces = NumTraceFiles;
    TraceLibConf->simulator_clock = 1000;
    TraceLibConf->mapping_mode = 0;
    //Optional parameters    TraceLibConf->factorTime = par("trace_factorTime");
    TraceLibConf->window_size = par("trace_windowSize");
    TraceLibConf->mpi_mode = par("trace_mpi_mode");
    TraceLibConf->zeroSizedPacketsSupported = 0;
    //Trace NIC configuration
    TraceLibConf->nic_conf.NIC_mode = NIC_STOPGO;
Once this the conf_t struct is initialized inside the simulator, there are other functions from TraceLib that need to be called in order to generate and receive the messages recorded in the VEF trace. We advise to take a look into the tracetor program in order to identify this method.
References
[1] https://gitraap.i3a.info/fandujar/VEF-Prospector
[2] https://gitraap.i3a.info/fandujar/VEF-TraceLIB
[3] Andújar, F.J., Villar, J.A., Alfaro, F.J. et al. An open-source family of tools to reproduce MPI-based workloads in interconnection network simulators. J Supercomput 72, 4601–4628 (2016). https://doi.org/10.1007/s11227-016-1757-0
[4] F. J. Andújar, J. A. Villar, J. L. Sánchez, F. J. Alfaro and J. Escudero-Sahuquillo, “VEF Traces: A Framework for Modelling MPI Traffic in Interconnection Network Simulators,” 2015 IEEE International Conference on Cluster Computing, 2015, pp. 841-848, doi: https://doi.org/10.1109/CLUSTER.2015.141
[5] Andújar, F.J., Sánchez de la Rosa, M., Escudero-Sahuquillo, J. et al. Extending the VEF traces framework to model data center network workloads. J Supercomput (2022). https://doi.org/10.1007/s11227-022-04692-0
Further resources: tutorial demo
This is a recording of an online training session on VEF traces organised by the authors of this article for the RED-SEA consortium partners.